Measuring Impala performance using Apache JMeter
With the continuing rollout of access to our datawarehouse via Impala it is becoming more important to understand the performance characteristics with different loads. So we decided to quickly put together some JMeter scripts to inject load. This is surprisingly easy, but also works surprisingly well.
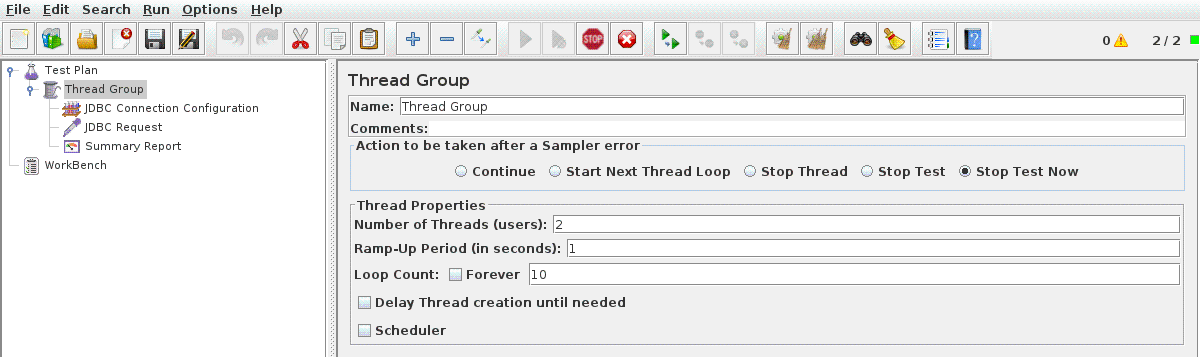
First, like every JMeter project, we add a thread group. This needs configuring to set the number of concurrent queries we want to run. We’ll keep this low to begin with so that nobody shouts at us.
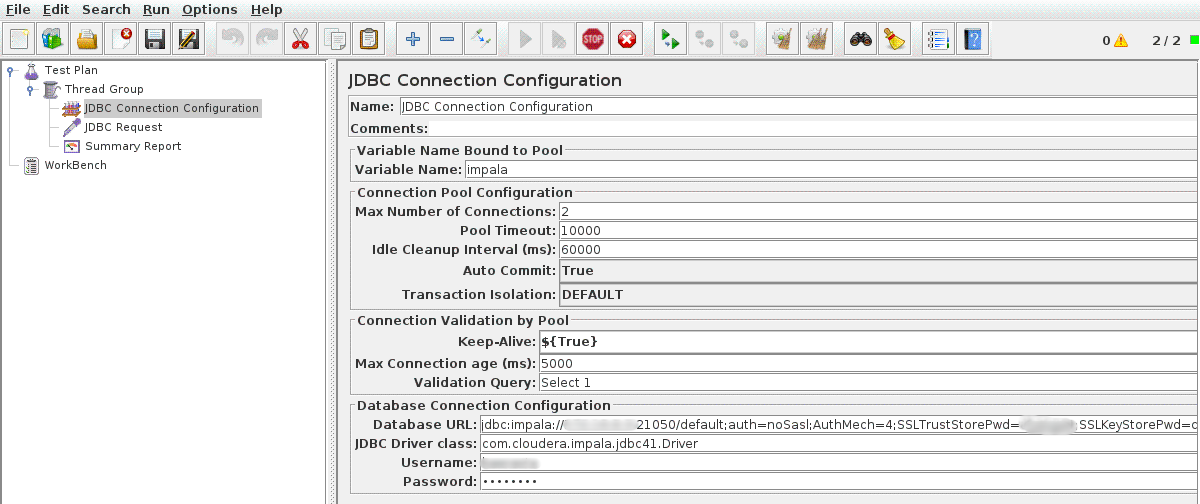
Below that we add some configuration for the JDBC connection by adding a JDBC Connection Configuration Config Element. We need to set the maximum number of connections to the same number of concurrent queries that we set above. We also need to give this configuration a name by adding it to the Variable Name.
Then we can add the query we want to run by adding a JDBC Request Sampler, setting it to use the connection configuration we set above - the same Variable Name.
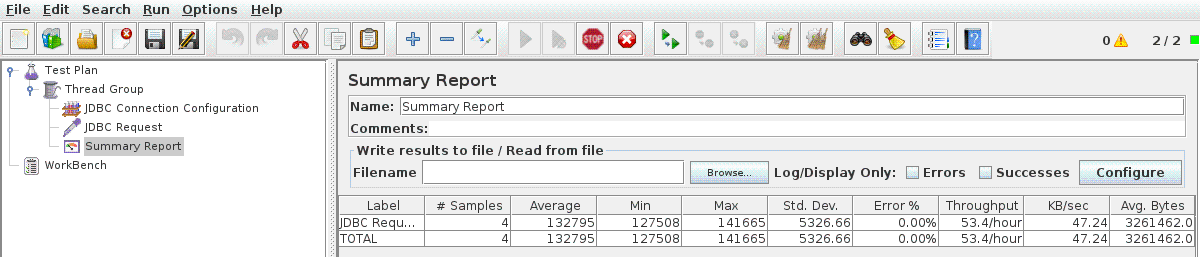
And the final element we need to add is the Summary Report Listener to give us some timings.
Assuming the Impala JDBC Jars are in the classpath, we can now hit run and wait for the queries to return. If the jars aren’t already on the classpath then they can be added individually from the root Test Plan.
If you’re using DNS round robin to distribute traffic across multiple Impala daemons then you’ll probably notice that all of your queries are going to the same worker. Further testing will show that this isn’t too much of a problem, but is something we can easily prove this by running HAProxy locally.
The numbers we’ve got out of this so far aren’t terribly interesting in themselves, but we have managed to show that an HDFS Namenode issue was directly affecting Impala performance.