JiraR Introduction
I’ll begin this post by clarifying that I am not a Scrum Master, or an Agile Coach. But I have always been a member of agile teams, interested in work being done, and frustrated when work gets blocked on its way to live.
This post introduces JiraR. Our tool to read a Jira Api and create a report showing the flow of work - in chart form! Charts, graphs and pictures are a great way to visualise any blockers or highlight possible improvements to the workflow. Exposing this information to our squads has led to them reviewing their stats, annotating them, explaining changes and ultimately; driving improvements in their workflow themselves.
Kanban boards work great to show the current state of play, but asking questions on the history of the ticket is more complex. These days at Sky Betting & Gaming, we track most of our development tasks in Atlassian’s Jira. This gives us a nice history of work done and allows us to see changes over time. The built-in REST api lets us access this information.
Our Favourite Graph - Phased Cycle Time
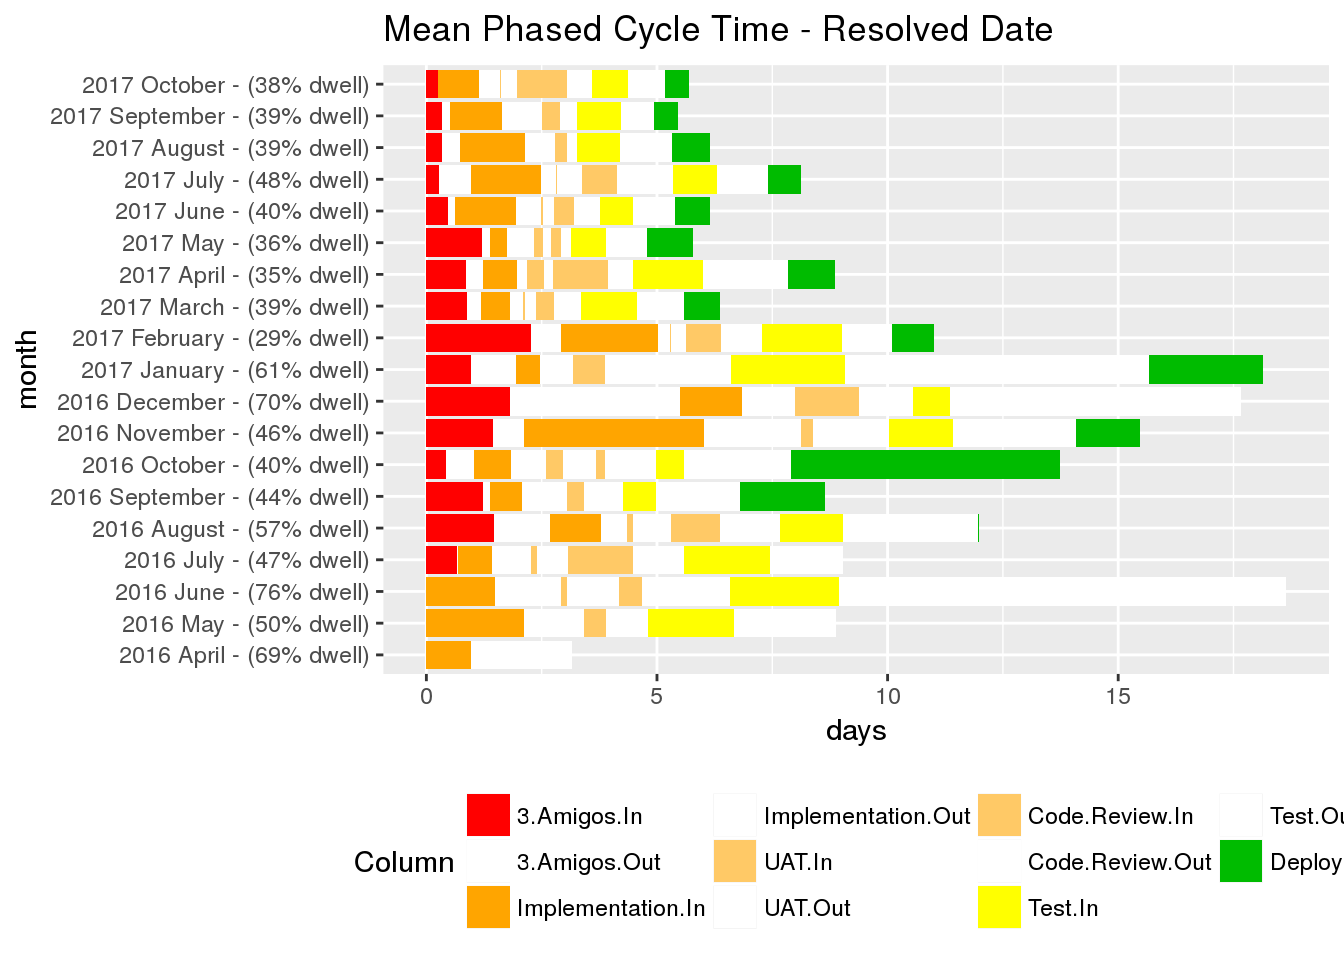
The Phased Cycle Time charts are quite complicated, but they can be interpreted in a few different ways to gain different information.
- Average cycle time: the length of the full bar.
- Change in average cycle time each month.
- Dwell Percentage: you don’t need another blog post to explain why dwell time ruins projects.
- ‘Dwellfull’ Columns: dwell columns are drawn white, and drawn in the correct place for our Kanban board. Are tickets waiting for developers to pick them up? Or are they waiting for a release token to become free?
- Release contention: we deploy to a number of environments before live. Each one is used by more teams than the last, giving more chance to block teams. The longer we spend in the deploy columns, the more risk we bring to other teams.
A little Story: January 2017… The squad in the above diagram were ticking along with >15 days cycle time. The percentage of dwell time reached 70% over the festive holiday period. All columns were utilised and the people looked too busy to pick up tickets urgently.
During a retro the squad had a think about why their dwell times were so large. After a small amount of discussion, they realised that tickets were moving backwards and forwards through the board, each jump back adding dramatically more dwell time. By rushing, they were missing requirements and introducing bugs.
The squad decided to refocus on 3 Amigos and Elaboration - spending their time early on, to clarify the work.
The next month, their dwell time had reduced to below 30%. By the following month they had halved their average cycle time as the increased understanding improved more of their development.
The squad knew there was a problem, but were surprised to find their dwell time so high. When they could see the problem, they were able to think about how to solve it.
Making Time For Tech-Debt - WorkType Distribution
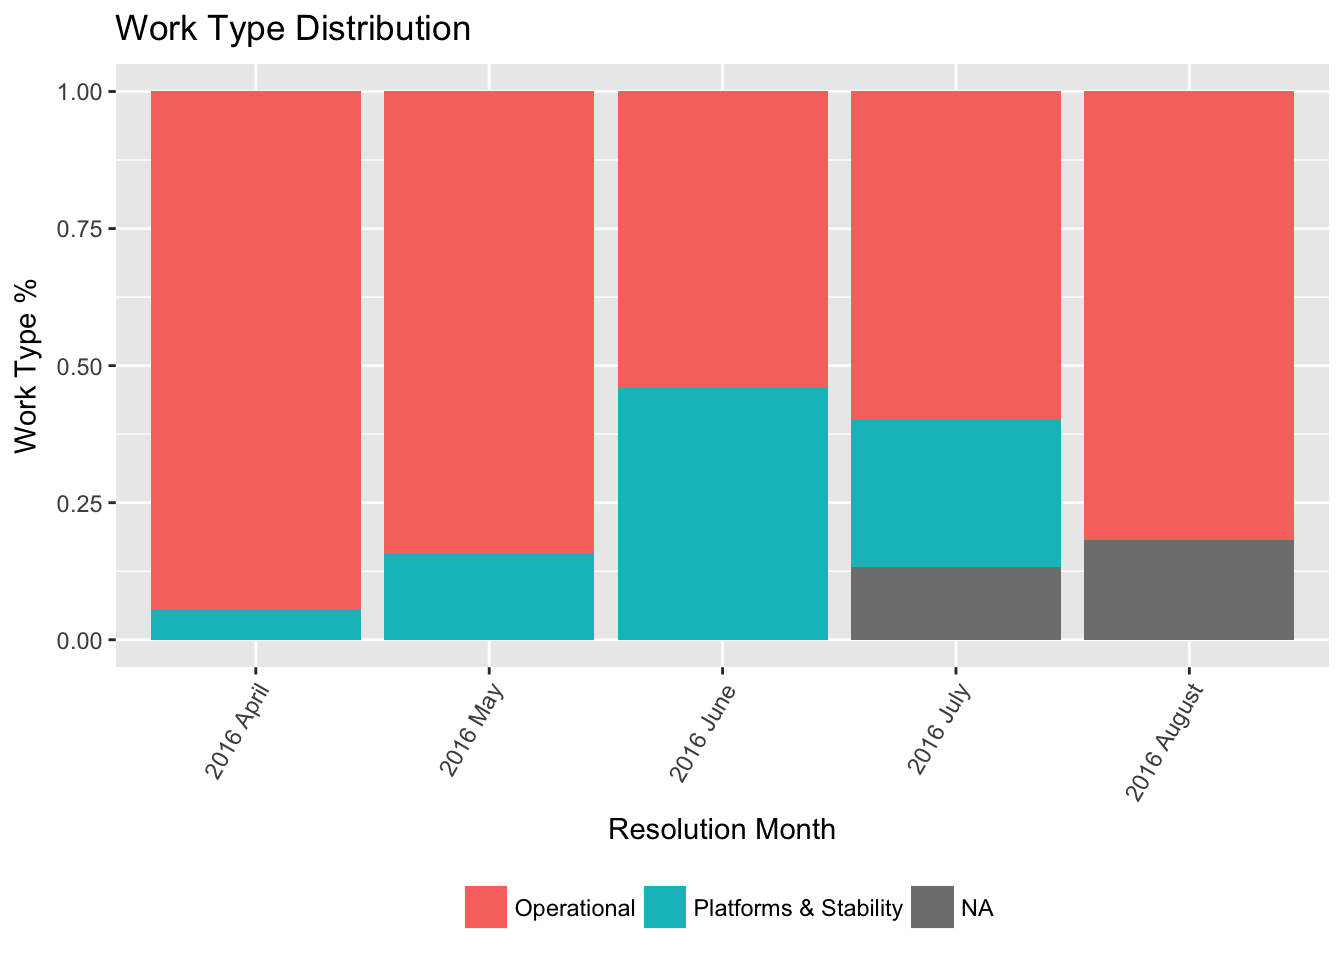
Our management suggest we split our work so that 70% of our time is roadmap work, with the remaining 30% split between BAU and addressing Tech Debt. This chart shows what our actual distribution of completed tickets is, using a CustomField in Jira to record the work-type.
Using this information, squads have evidence to give to their product owners to ‘self-correct’ when they are being asked to do too much roadmap work. Everyone knows letting tech-debt build up is troublesome, the best way to tackle it is to keep on top of it.
This doesn’t mean that we can only spend 30% of our time resolving tech-debt. This chart also shows when squads are spending too much time fixing tech-debt. Then a piece of tech-debt may be elevated to the roadmap. Giving the squad time to think through the problem fully, by devoting more resource to it.
What else
- Velocity: Number of tickets completed
- Column Usage: Which columns get skipped?
- Burnup: Businesses love burnup
- Spend: How many tickets are completed as CAPEX vs OPEX (from a CustomField in Jira)
Using this yourself
The code is available at: https://github.com/skybet/jirar The instructions looks something like this:
- Clone repo https://github.com/skybet/jirar
- Build/pull Docker containers
- Write your config details into the config files
- Generate your hashed Jira Access Token from your username and password
- Start the RUNME.sh script
Docker containers will soon be published and the README updated, but until then you can build the docker images yourself and set up your config by following the instructions in the README
Begin by populating the links to Jira’s REST endpoint in atlassianDetails.sh and putting your project’s boardId in extract/boardList.js…
You are ready to run the RUNME.sh script with your credentials.
echo -n Username:Password | base64 #Get your jira access token
#sh ./RUNME.sh <JIRAACCESSTOKEN> <PROJECT> <PUBLISH?>
# E.G.
sh ./RUNME.sh <usernamepasswordhash> TS
All being well, This extracts the data from your Jira api using the Node.JS script in the jirar-extract container and writes some data into a local CSV file.
Next, it runs a Rmd script (R Markdown) to generate the graphics from that CSV file.
Optionally, if you have added your confluence details in atlassianDetails.sh, it uploads the report to confluence for others to see.
Read the jiraR README for advice on setting up Jira’s CustomFields to power the worktype and spend charts.
Summary
Hopefully this post has inspired you to visualise your own projects and talk about the output with your team. Anyone can kickoff the discussion as everyone hates being blocked, so why not start today… The reports built into Jira are a good starting point, but sometimes you need more. Hopefully this project is simple enough to encourage you to experiment with personalised views of your own workflow.
Check it out here: https://github.com/skybet/jirar