JMX Metrics in Kafka Connect
For those of us who have been around for a while it is obvious that well-written Java applications expose a bunch of useful metrics via JMX and that graphing and alerting on these is the standard way of monitoring these applications. It’s so obvious and well-known that this isn’t written about, and often isn’t covered in the software’s documentation. And this is a problem for the people for whom this isn’t obvious.
In reviewing a recent incident involving a Kafka Connect worker it became obvious that there is a gap here. The team running the Kafka Connect cluster were not aware of the rich JMX metrics, and were instead prodding the source and destination stores in various ways. They weren’t doing anything with the JMX metrics because they weren’t aware of them.
It’s true that JMX metrics are not particularly easy to use if you do not have a lot of experience in JVM applications, so let’s talk about the metrics we can get from Kafka Connect and how to use them.
Zenreach Engineering have already done most of the work in exposing the Kafka Connect JMX metrics with their Docker image that includes jmx_exporter for Prometheus. But lets take a look at what’s involved as a learning exercise.
Exposing the JMX metrics
JMX Metrics are exposed remotely via a TCP port, but most JVM applications don’t expose their JMX metrics by default so we’ll need to pass in some additional commandline parameters. The exact parameters and how you add them varies by application, but generally look like:
-Dcom.sun.management.jmxremote \
-Dcom.sun.management.jmxremote.port=9010 \
-Dcom.sun.management.jmxremote.authentication=false \
-Dcom.sun.management.jmxremote.ssl=false
If you plan on exposing these metrics over the network then you will want to investigate the authentication and SSL options, and you may need to set the advertised hostname too depending on your setup. However since we are not exposing the JMX port over the network (and are connecting to localhost), we will not cover these here.
We can now restart the application with these new parameters and we should see that the application is additionally listening on port 9010 (or whichever port you picked) by running netstat -lntp.
JConsole
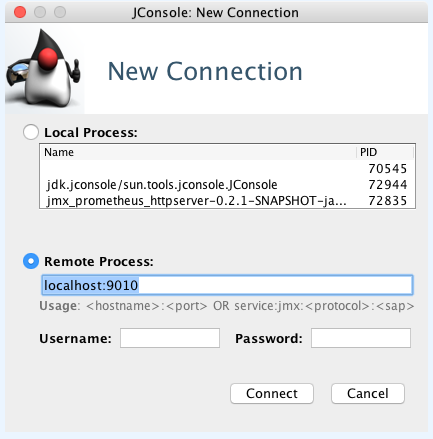
If you are running the application on your desktop or laptop environment, then you probably already have jconsole installed. Running this will give you a GUI for connecting to the remote process and then give you some nice graphs for all the JMX metrics. This is useful for very quickly checking that JMX metrics are being exposed correctly, but it is not particularly useful for monitoring the application.
JMX Dump
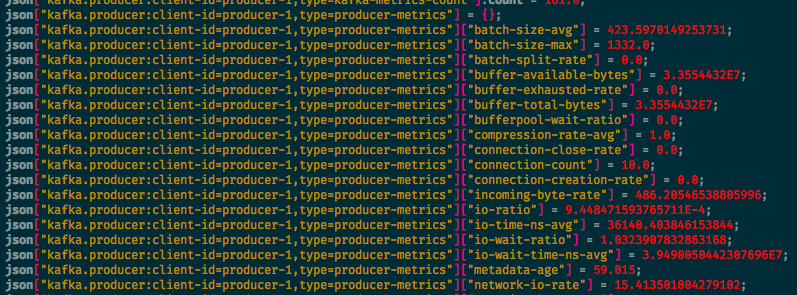
If you don’t have an environment where you can connect to the JMX port from a GUI application then jmx-dump will be helpful. As the name suggests, it dumps JMX metrics to the console in JSON format.
java -jar jmx-dump-0.7.3-standalone.jar --dump-all -p 9010 | less
Here is a good place to mention Gron - a portable commandline tool which makes JSON greppable and nicely colorises it. Piping the output of jmx-dump into gron makes it much easier to read through the available metrics and document them.
At this point we could finish the blog, we have a way getting metrics from the application which you can parse using your favorite language and import into your monitoring tool of choice. However, most of the teams around Sky Betting and Gaming are standardising on Prometheus and Alert Manager for their monitoring, so lets go a little further and actually monitor these metrics.
Prometheus
Prometheus is a monitoring tool which ingests metrics, makes them graphable, and exposes them to Alert Manager which can send out alerts using a number of methods. It pulls metrics from HTTP endpoints which are added to the Prometheus configuration file. We therefore need a way of exposing the Kafka Connect metrics over HTTP in the format that Prometheus understands.
JMX Exporter
Prometheus provide JMX Exporter, a “collector that can configurably scrape and expose mBeans of a JMX target”. It exposes the JMX metrics that we have seen with the tooling above via an HTTP server in a format that Prometheus understands.
JMX Exporter can run in either of two modes - as a Java agent that is injected into the application you want to monitor or as a standalone process that connects to the JMX ports we have exposed. Running it as an injected Java agent exposes additional CPU and memory metrics, is easier to configure for some applications, and performs far better when there is a large number of metrics. In this case we are choosing to run JMX Exporter as a separate process because we can more easily reuse existing Chef code and because it is easier to develop, and this is how we are monitoring both Kafka Connect and Kafka Mirror Maker in production. However, on Kafka brokers with hundreds of topics this method of running JMX Exporter is not performant enough, and in this case we inject the Java agent instead.
Because Prometheus recommend not running JMX Exporter as a separate service, there is limited documentation around actually doing this. At Sky Betting and Gaming we have a Chef recipe that installs, configures and runs the service on a server. For everyone else, you need to clone and build the JMX Exporter code from GitHub to generate jmx_prometheus_server.jar and then run it with:
java -jar jmx_prometheus_server.jar jmx_exporter.yaml
Picking metrics
Actually parsing JMX metric names and values is somewhat arcane knowledge, and this is often the hardest part of this whole setup. It is important to note that order of keys is important and that JMX Dump doesn’t retain order, so this is where we bring up several screens at once - the output of JMX Dump to easily scan through available metrics, the JMX Exporter configuration file, the running JMX Exporter, and curl output of multiple versions of JMX Exporter.
A good starting point is to use JMX Dump to discover the highest level metrics possible and begin with those.
All of the Kafka services, including Kafka Connect, expose JMX metrics beginning with ‘kafka’ so this is a good starting point as a pattern for JMX Exporter. The following configuration is the minimal configuration required to get JMX Exporter exposing the Kafka Connect JMX metrics:
lowercaseOutputName: true
hostPort: 127.0.0.1:9040
ssl: false
rules:
  - pattern: kafka*
With this configuration in place and the JMX Exporter process running, we can curl it to get back all of the kafka metrics:
curl localhost:8080/metrics
The output includes valid patterns that we can use to configure more specific metrics in the JMX Exporter configuration file. This will let us pick just the metrics that we care about, and it will allow us to give them more sensible names. Configuring these patterns takes some trial and error, but will eventually lead to a configuration file for Kafka Connect that looks something like the one that Zenreach are using in their Docker container.
This configuration file is also a good starting point if you are configuring JMX Exporter for other Kafka services, as it covers most of the ways of extracting metrics and many of the metrics across the Kafka services follow a fairly similar format.
With the metrics that we care about being exposed by the JMX Exporter HTTP interface, we can now configure Prometheus to regularly poll this HTTP endpoint. And we can then configure alerts in Alert Manager and build dashboards in a Grafana instance attached to Prometheus. We should now have graphs on a screen in the office, and out of hours alerts being sent to on-call engineers.
Hopefully this post has encouraged you to start using JMX metrics not just for Kafka Connect, but the whole of the Kafka platform as well as any other Java applications you might have running on your network. Not every application has custom metrics that are as useful as the Kafka ones, but all Java applications will expose at least JVM metrics.