performance.now() Conference 2019.
Introduction
I recently attended the performance.now() conference in Amsterdam courtesy of Sky Betting & Gaming’s Tech Ninja Fund. performance.now() was a single-track conference with fourteen world-class speakers, covering today’s most important web performance insights. As a performance test engineer with keen interesting in front-end performance, I was looking forward to catching up on the latest development, ideas, and approaches in the industry and also hoped to pick up some tips along the way.
In this blog post, I intend to summarise my key takeaways from the conference and give a summary of some of the less technical talks with links to associated content.
Takeaway 1 - Web performance is as challenging today as it ever was
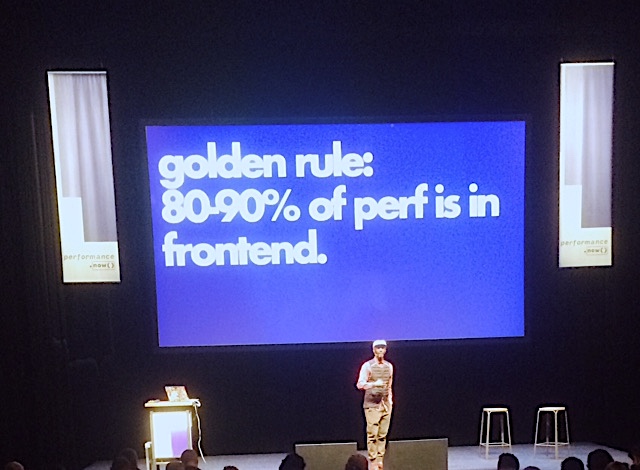
Web performance has a massive influence on the quality of a users experience and as such has always been a big topic in web development. Back in 2007 Steve Souders, the godfather of web performance, wrote “High-Performance Web Sites”, a guide for those wanting to improve web site performance. Things have moved on a long way since then both in terms of user behaviour and technology. Despite these changes, one thing still holds true - “80-90% of end-user response time is at the frontend.”
As a performance engineer with a focus on ensuring our websites are stable and can cope with predicted load, it’s easy to lose sight of the fact that front-end performance is of equal importance and shouldn’t be seen as secondary concern or problem for only front-end developers to address. After all, it’s no good having a 100% uptime if customers are turning away because the site is slow and unresponsive.
“The quickest request is the one never made” - Henri Helvetica
The opening talk of the conference was from Henri Helvetica, a freelance developer, entitled “A decade of disciplined delivery” in which he walked through the 14 rules set out in Sounders seminal publication to see how relevant they are today.
Here are a few of his examples which show how things have changed:
- Making fewer HTTPS requests - average website requests up over 300% since 2011
- Use a CDN - 48% of sites still not served from CDN
- Add Expire headers - only ~15% of sites have Lighthouse caching score over 80%
- Gzip components - only 60% of sites are 100% compressed
- Minify JavaScript - 600% increase since 2011 for average site
From these and other examples provided, it is clear that the 14 rules remain relevant and failure to fully adopt them shows that there is much work still to be done. As Henri pointed out in his talk - the massive shift from desktop to mobile is key to these changes with mobile devices eclipsing desktop in terms of web access back in 2016. Recent figures put the split at 52.48 to 44.59% in favour of mobile. Alongside the growth in mobile usage greater mobile device fragmentation further add to the challenge.
“We’ve built a web that largely dismisses affordable typical smartphones and the people that use them” - Tim Kadlec
Tim Kadlec, a performance consult and trainer, gave a talk entitled “When JavaScript bytes” in which he highlighted the cost of JavaScript and the practical ways it can be reduced. Tim made an interesting comparison between the 1.7MB of code that helped land man on the moon and the 1.8MB shipped for your average mobile site. A big difference in code and purpose but it does show what can be done where necessity dictates. Tim emphasises the fact that JavaScript byte-for-byte is the most expensive resource on the web with x3 performance penalty in terms of network, on-device and execution cost. With many sites neglecting to follow best practices like compression and reduction in bundles sizes, coupled with widespread use of lower spec mobile devices on poor networks, there should be no room for complacency. Tim suggests enforcing strict limits on code size from outset else continuing to chip away at legacy code while there is the opportunity to do so.
“Everyone who works on a web product shares ownership of performance and security - whether they know it or not” - Simon Hearne
Simon Hearn, Web Performance Solutions Engineer as Akamai, gave us a talk entitled “Deep dive into third-party performance”. Through looking at post-mortems of recent incidents Simon sought to equip his audience with the stories, tools, and techniques to manage third-party content and what to look out for when evaluating a new third-party service. As you’d expect, third-party web content has seen a similar trajectory of growth to that of JavaScript in recent years with the median website now made up of 37% third-party requests. In his talk, Simon acknowledges that third-party content, though a source of revenue, can become a source of irritation that creates friction between development and marketing teams. He encourages everyone to become third-party subject matter experts to advance both their careers and the products they work on.
Takeaway 2 - In performance engineering data is your friend
While progress in addressing the issues contributing to poor web performance has been slower than many might have envisaged, the same cannot be said for the tools available to help tackle the problem. The last 10 years have seen the proliferation and advancement in monitoring solutions and diagnostic tools that provide the insights needed to help improve web performance. Monitoring solutions like NewRelic and AppDynamics can provide a 360 degree view of performance from infrastructure to application and Real User Monitoring (RUM). Tools like Lighthouse also provide valuable information aimed at improving site quality through analysis of pages against best practice criteria. All the talks at the conference drew on important insights obtained from these tools and it is true to say that web performance monitoring and diagnostics is no longer the dark art it once was. However, like anything - you need to ensure you choose the right tool for the right job.
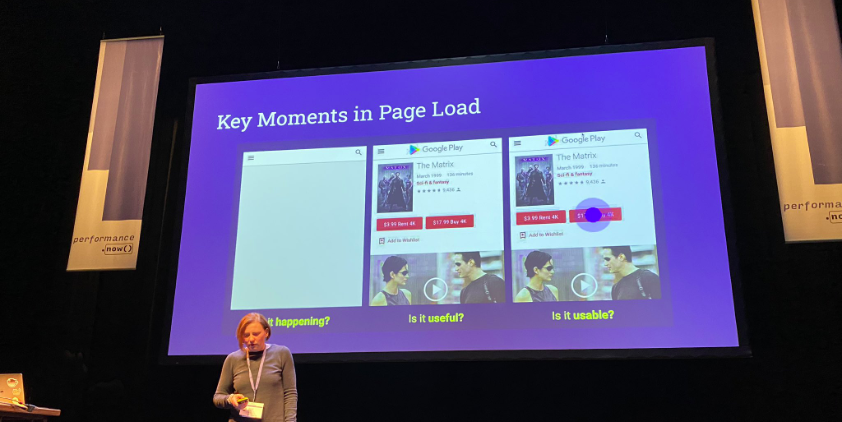
“We need good top-level metrics” - Annie Sullivan
Annie Sullivan, Software Engineer at Google, gave a talk entitled “Lessons learned from performance monitoring in Chrome”. Annie talk covered performance metric and benchmark design, dealing with benchmark noise in the lab, and understanding the subtleties of RUM data. With all the data now available to us it’s sometimes difficult to see the wood for the trees. Annie told us about the properties that make up a good metrics and their associated use cases. While acknowledging that obtaining accurate insights from the metrics isn’t always easy, by focusing on the right metrics in the right setting we can gain a deeper understanding of performance problems from the lab through to real-user experience.
Over the years I’ve made use of many tools to gain a better understanding of site performance - here are a few of my favourites that are free, easy to use, and provide a wealth of advice and insights :
-
Sitespeed.io: Not mentioned at the conference but one of my favourites. Sitespeed.io is a set of Open Source tools that makes it easy to monitor and measure the performance of your web site. Sitespeed.io is the complete toolbox to test and monitor your performance or checkout how your competition is doing.
-
WebPageTest: Simple to use and lots of options to play with. WebPageTest is used for measuring and analysing the performance of web pages. A test can be kicked off from a variety of locations with a range of different browsers and test configurations.
-
Pagespeed Insights: PageSpeed Insights (PSI) reports on the performance of a page on both mobile and desktop devices, and provides suggestions on how that page may be improved. PSI provides both lab and field data about a page. Lab data is useful for debugging performance issues, as it is collected in a controlled environment.
While quick one-off tests can be executed against your site with relative ease, with a little more work it’s possible to integrate such tests into your continuous integration pipeline to provide feedback earlier in the development lifecycle.
Takeaway 3 - Don’t be a performance cop
Once equipped with the knowledge, tools, and data necessary to improve site performance, there is still a very big challenge to managing and maintaining performance especially in a fast-paced environment where multiple teams can be releasing changes into production several times throughout the day.
“Everyone who touches a page should care about the performance of that page” - Tammy Everts
Tammy Everts talk entitled “The 7 habits of highly effective performance teams” shared tips and best practice gleaned from conversations with companies leading the way in web performance. These companies had one thing in common - they had a strong culture of performance.
The 7 habits covered in the talk were as follows:
- Performance is a marathon, not a sprint
- Have a champion higher up
- Build a cross-disciplinary team
- Set shared goals
- Make everyone accountable
- Communicate
- Don’t forget to celebrate
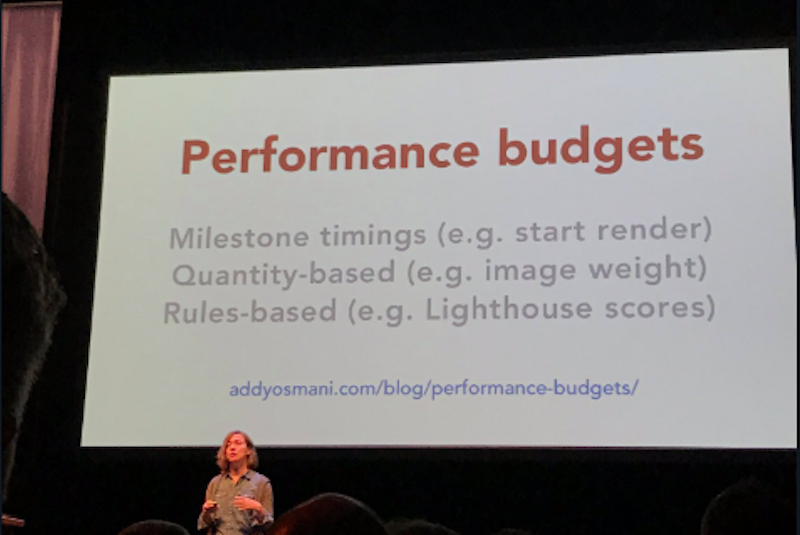
Like other speakers, Tammy emphasised the need to set performance budgets. She recommends that budgets should be clear on what the budget is, when you go out-of-bounds, how long you were out, and when you’re back in credit. With budgets in place, it should never be the responsibility of one person or a single team to act as a performance cop - with the right culture everyone shares ownership and understands the impact of what they do. While it is benificial to have performance specialists, performance must be collectively owned and considered from the outset for all projects and changes, through all stages of development and through into Production.
Final thoughts - performance for the many, not the few
As the web continues to evolve, performance engineers and web developers alike need to stay on top of their game, adhering to best practice principles while also seeking new opportunities to improve web performance through process, design, and tooling. Web design and development has come a long way over the last decade with mobile-friendly sites and responsive design now the norm. However, as sites continue to grow in size and complexity, alongside increasing mobile device fragmentation - there is a greater need than ever to ensure that we help build a web that performs for the many, and not just the few.
If you’re interested to learn what the future of web performance might look like, it’s worth checking out the final talk of the conference from Vitaly Friedman, Creative lead at Smashing Magazine, entitled “The Future of Performance”. Amongst other interesting insights, he tells us that 5G will likely widen the gap between the haves and have nots, rather close it.
Details of all the talks can be found here. I highly recommend the performance.now() conference, not just for those involved in web performance but anyone interested in web development in general and keen to advance their understanding of front-end web performance. It also helps that it is friendly, well organised, and Amsterdam is a great city to visit.
The third edition of performance.now() will take place on the 12th and 13th of November 2020. Sign up here to be notified when ticket sales open: https://perfnow.nl